Last February, a plume of Saharan dust carried by Atlantic winds passed over Europe, dropping daily irradiance by up to 25%, as dust in the atmosphere scattered, absorbed and reflected sunlight. Prevalent westerly winds carried the dust from the Iberian peninsula on the 14th, to Germany on the 16th. Areas impacted during the middle of the day saw peak irradiance losses of up to 30%, and large areas of northern Europe, in particular the Netherlands and Germany saw 15-25% of daily irradiance lost on the 15th and 16th of February.
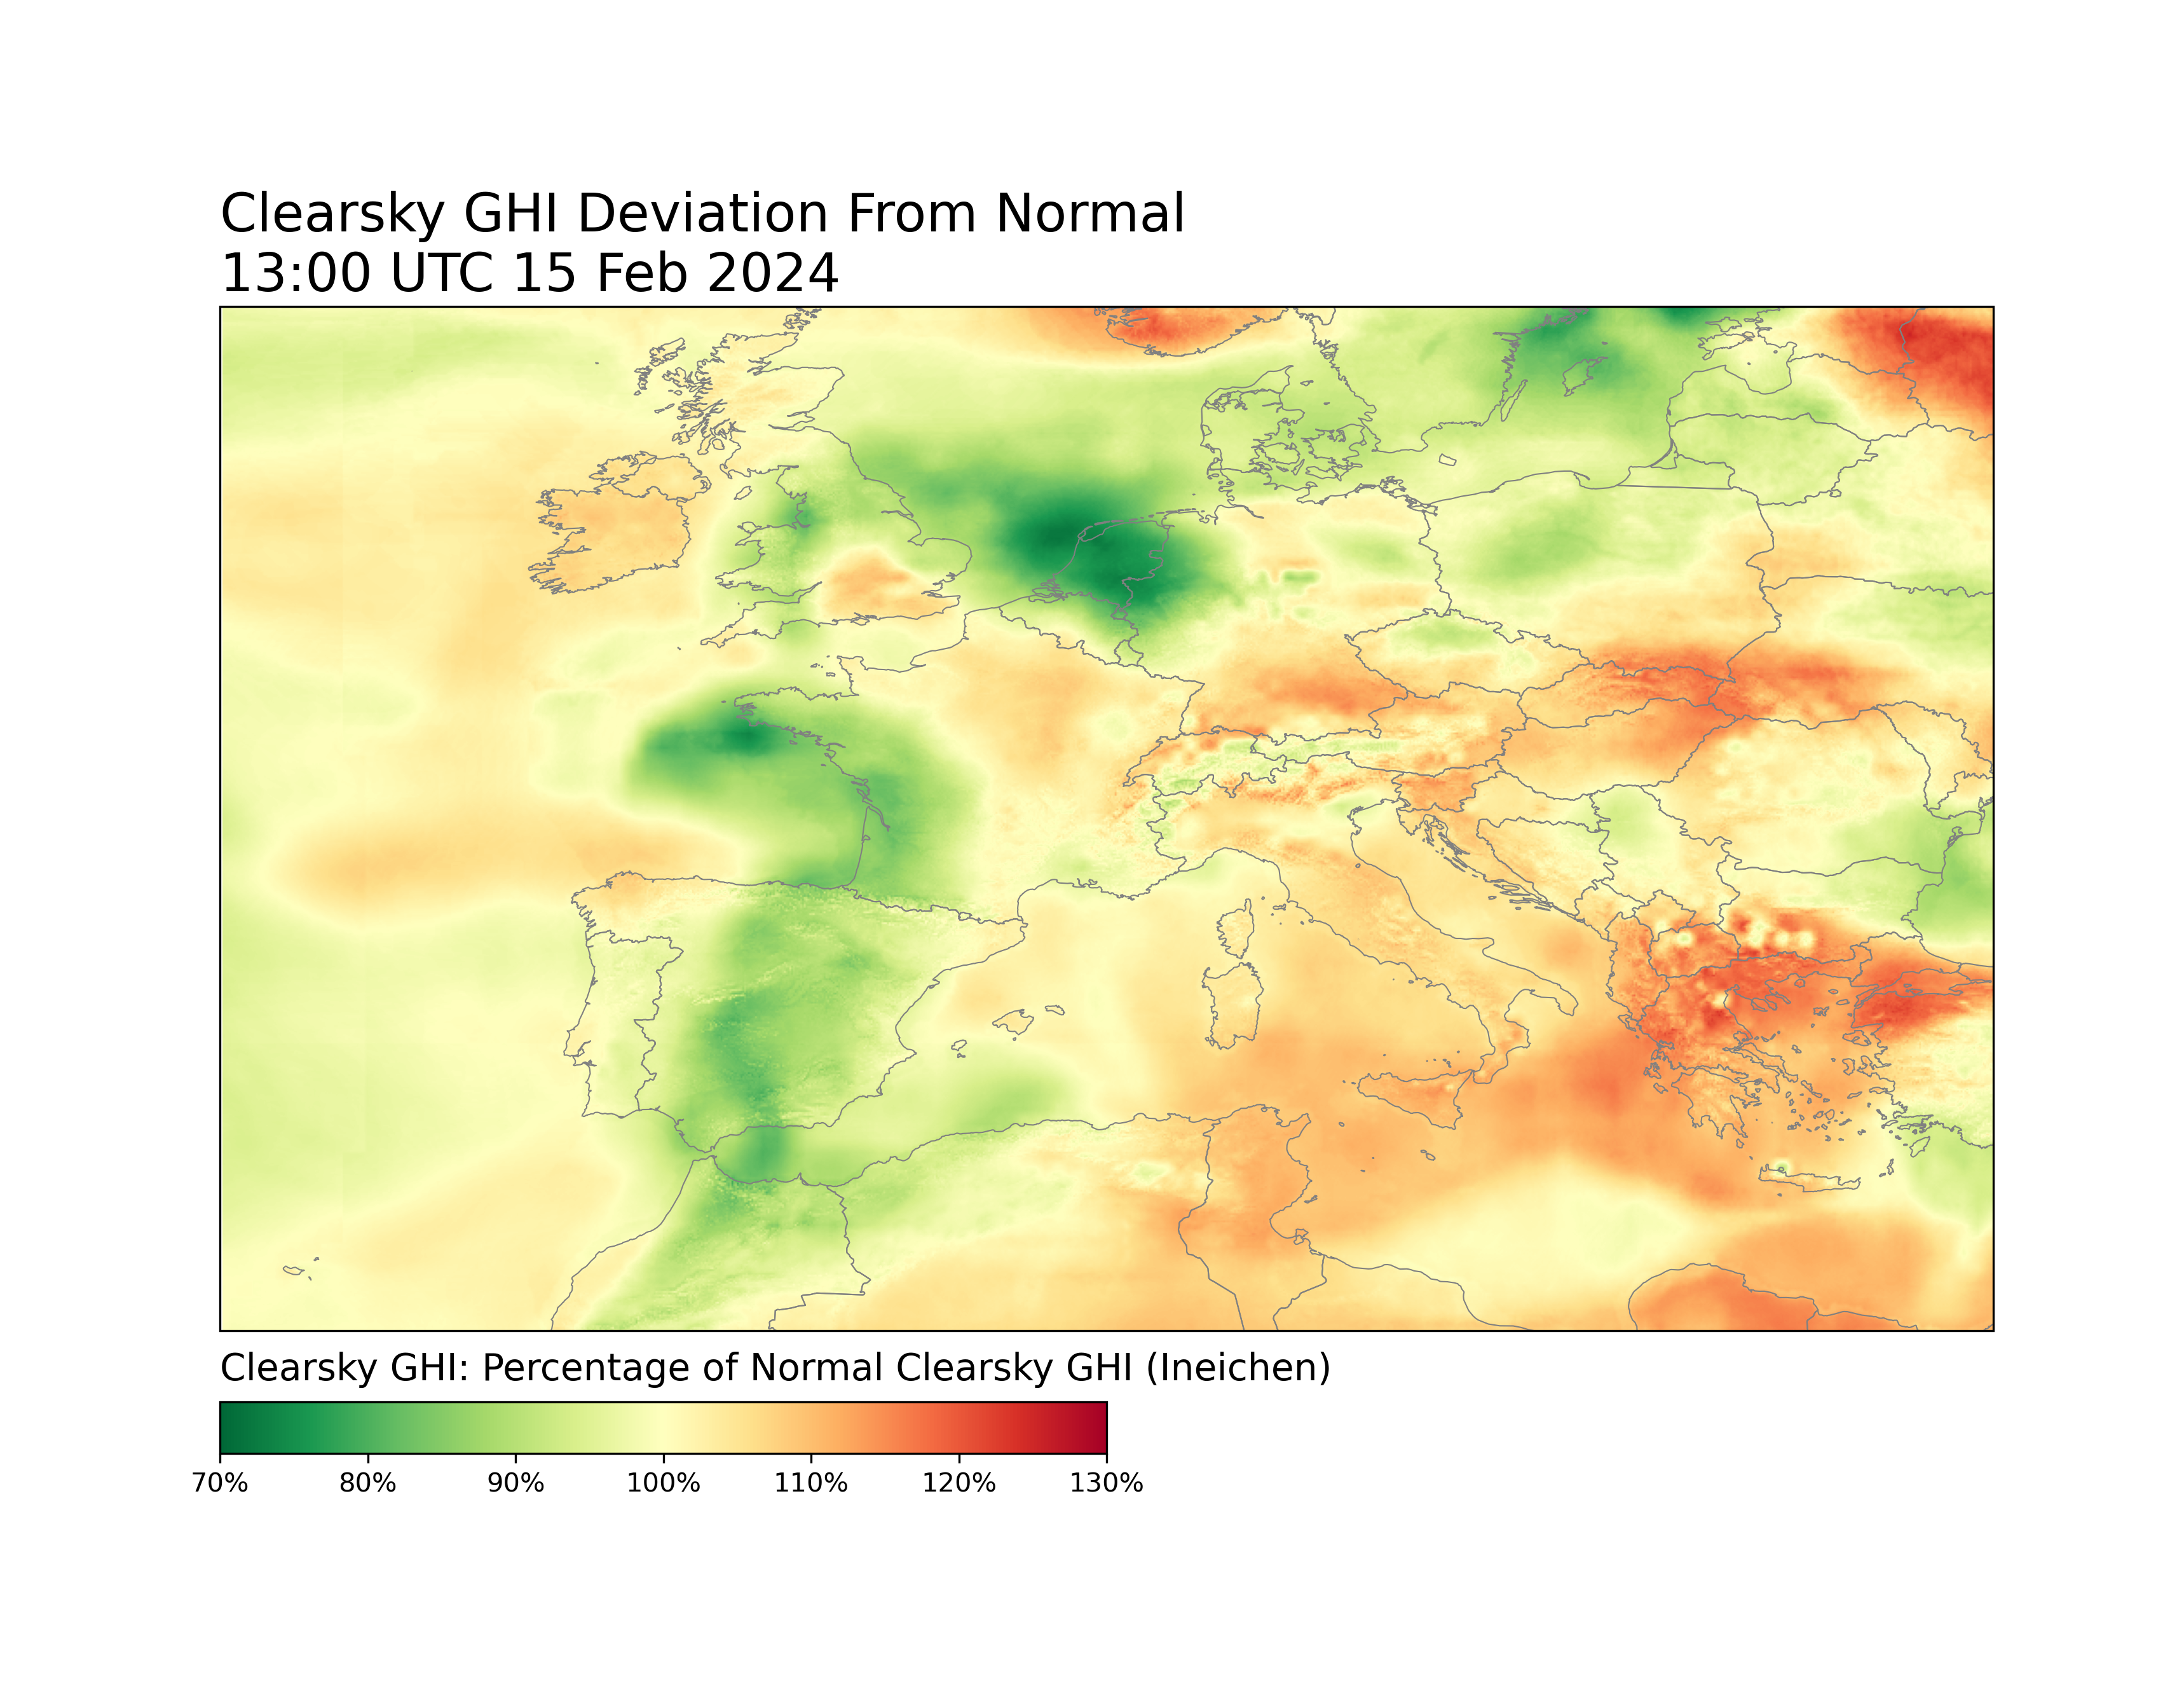
On the 14th, a high pressure system over north Africa and low pressure in the Norwegian Sea directed westerly winds across the continent in the low to mid levels of the atmosphere, carrying Saharan dust from west to east across Europe. Dust in the atmosphere reduces irradiance by scattering sunlight as it passes through the atmosphere, appearing as haze to viewers on the ground, and decreasing the irradiance received at the surface. Dust also affects solar production by settling on and soiling panels, decreasing generation efficiency even after the dust has cleared from the atmosphere. Asset operators in affected areas may find decreased generation from these soiling effects.
Impacts in Portugal and Spain
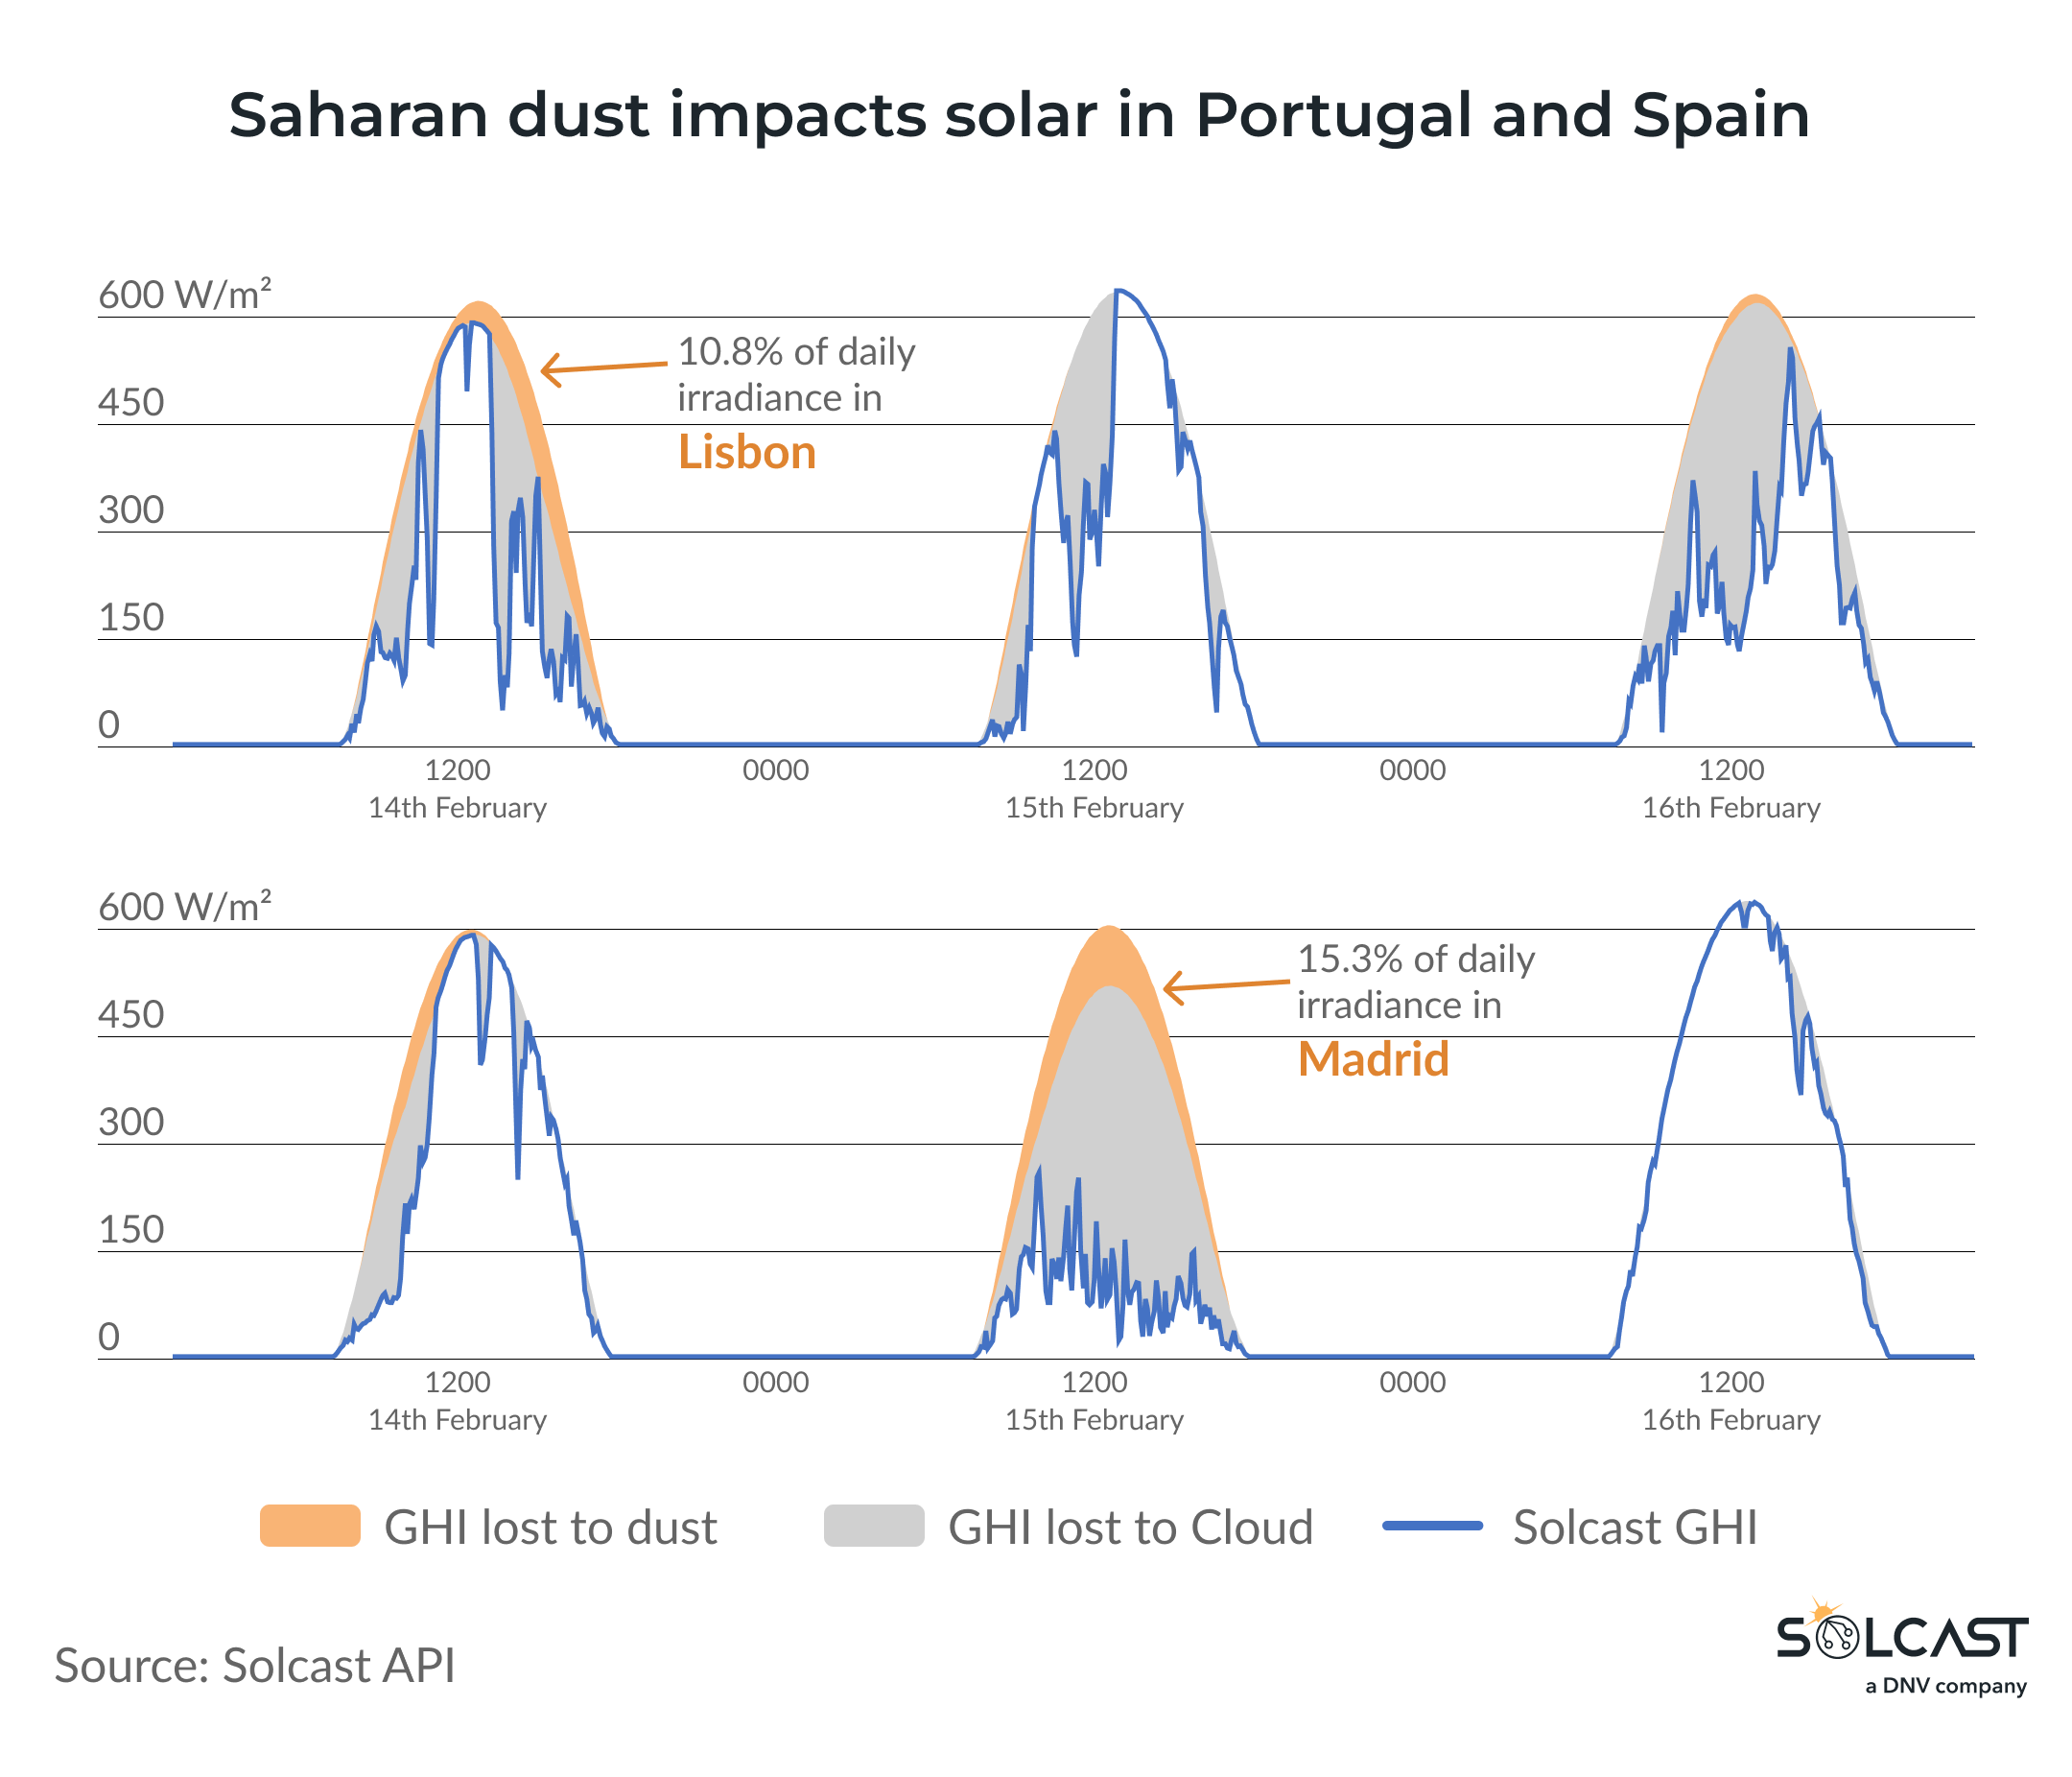
As the dust impacted Portugal mostly in the late afternoon and early evening Lisbon only lost 10.8% of daily production on the 14th. Contrast that to the 15% seen in Madrid, and higher in Northern Spain as the dust passed at midday on the 15th. Madrid and much of Spain saw a cloudy day anyway, limiting their total generation regardless of the aerosol impact.
Solcast's clearsky model also accounts for variations in other atmospheric conditions which explain the other differences seen from normal in other regions of Europe. For example, lower moisture over Spain on the 16th meant that there was above average clear sky irradiance, good news for asset operators following the cloud and dust losses the previous day.
Impacts in Netherlands and Germany
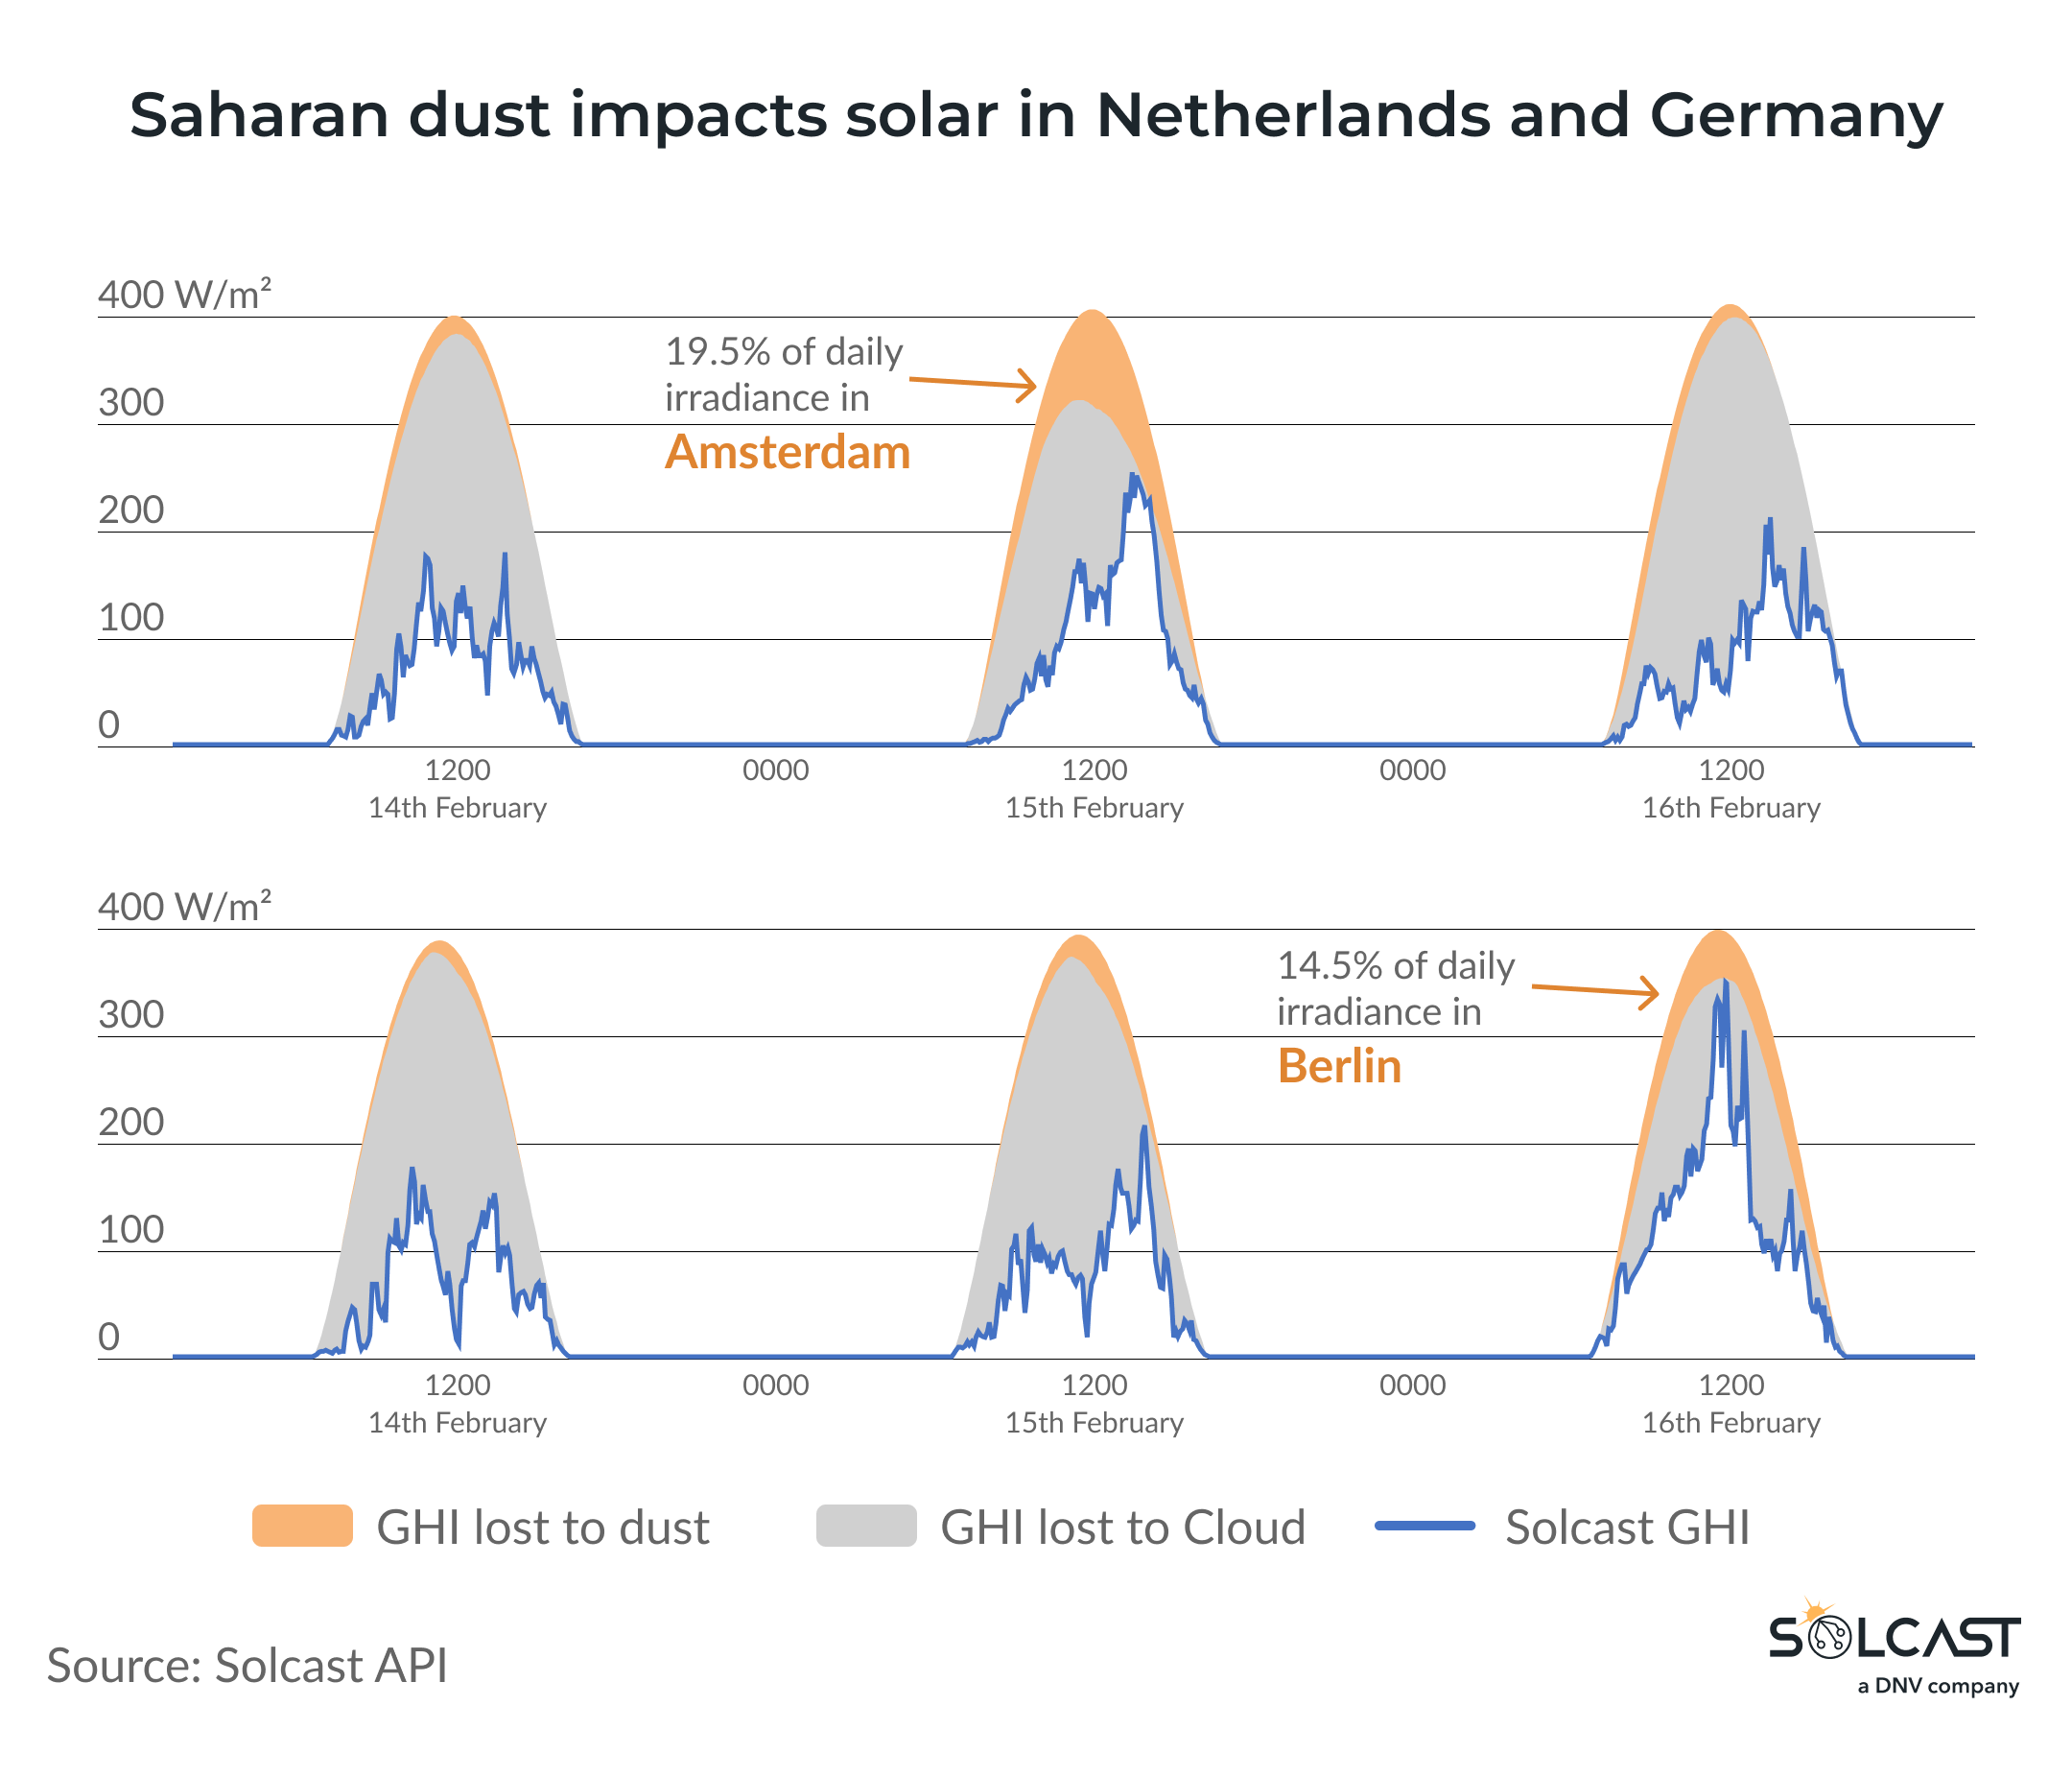
Further north, the effects were more pronounced, with parts of the Netherlands and Germany seeing up to 30% generation losses in the peak of the day, and total daily generation decreased by 15-25%. Interestingly the effects were localised enough that you can see the heavier dust losses in the afternoon in Amsterdam, something which on a cloudless day would materially impact the shape of the solar generation curve.
How Solcast model aerosols for irradiance and PV power data?
Dust events, while not frequent, typically happen most years in February and at other times. When they do happen, they can significantly impact your assets, as shown in the Solcast API analysis for Europe.
Given this, solar operators should take this into account when looking for the right data for solar.
Unlike standard weather data, Solcast has advanced aerosol handling which combines data from CAMS, MERRA2, AERONET, and elevation data for real-time updates. This data is further refined using machine learning to provide aerosol data at 90m resolution.
To prepare and navigate dust events like this, ensure you have access to irradiance data with proper aerosol handling. Reach out to our team to set up for a free trial or evaluate our data by creating a commercial toolkit account.

Dr. Hugh Cutcher
Hugh is a Data Scientist at Solcast. He holds a Bachelor of Engineering (Hons. I) in Mechanical Engineering and a PhD in Combustion from University of Sydney. Hugh believes that renewable energy is critical to ensuring a cleaner and safer world going forward and is excited to play a part in helping fulfil that potential.